

Adding Content
2.1 How to add a content
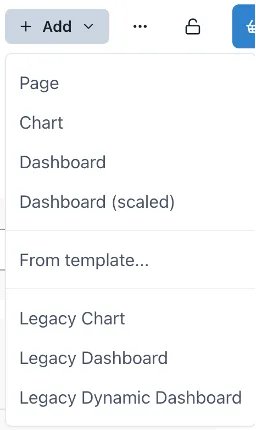
Section titled “2.1 How to add a content”To add more content to your workspace you can click the “+ Add” button on the top right corner. As it can be seen in the following image, there are different options under this button, and we will cover them in this section. All pages can be edited by activating the “Edit” toggle on the right side.
2.1.1 Add page
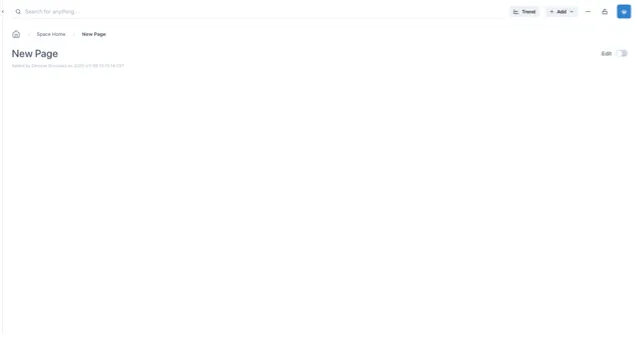
Section titled “2.1.1 Add page”To add a new page to a workspace you can click on the “+ Add” button and select “Page” from the dropdown menu. This will create a page in the current workspace you are in. When selecting this option, the page will appear with the “edit” toggle off and with default grid settings of 24 columns by 50 row height.
2.1.2 Adding chart
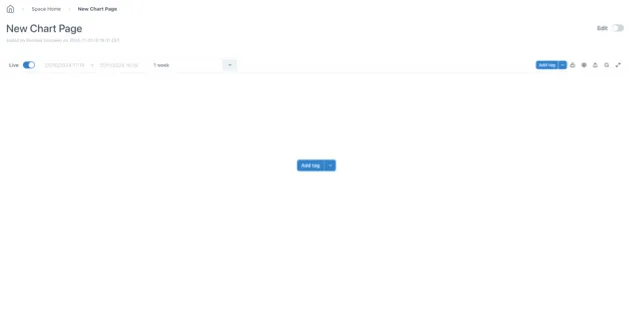
Section titled “2.1.2 Adding chart”Add chart will open a page with a chart component included in it. The chart will be the main component of this page but other elements such as levels, dials, numbers, etc. can also be added while on edit mode.
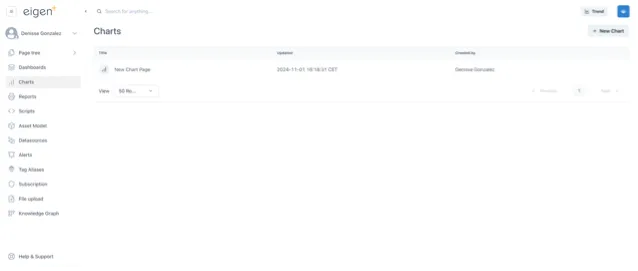
All Chart pages will be available under the “Charts” button on the left side menu. This will show you all the chart pages within the workspace you are in. “Add Chart” is the ideal option to start a page where the chart is going to be the main element in it.
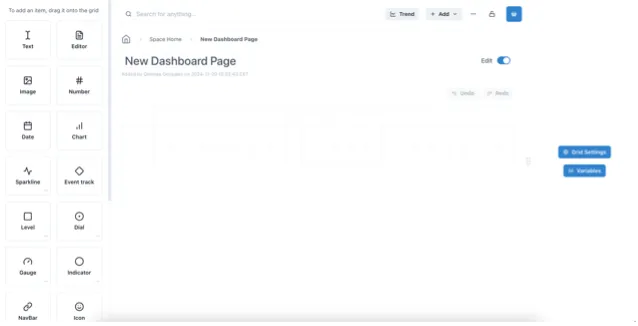
2.1.3 Add dashboard
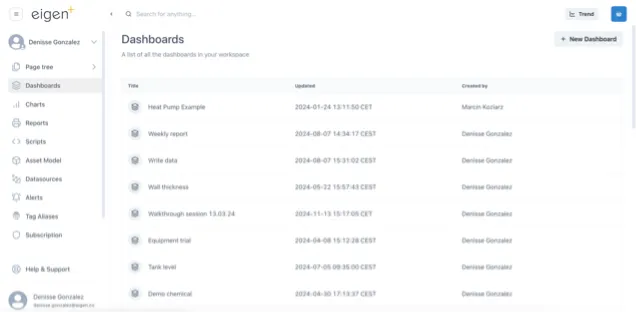
Section titled “2.1.3 Add dashboard”Adding a dashboard will open a page in edit mode with a grid of 24 columns and a row height of 50 px. By default, it will be showing the vertical and horizontal guidelines and the prevent collision will be activated. “Add dashboard” is the best option to quickly start a page that will serve as a dashboard and contain different elements such as numbers, text, charts, etc.
The pages created with this option will be available in the page tree of the workspace you created it in and under the “Dashboards” option in the left side menu of Ingenuity. This is a great option to have an overview of all the dashboards created in that workspace besides the page tree option.
2.1.4 Add scaled dashboard
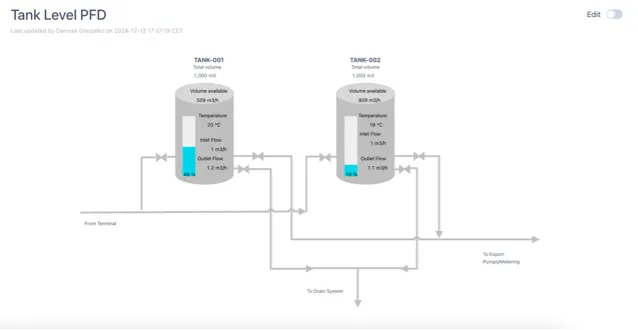
Section titled “2.1.4 Add scaled dashboard”The “Dashboard (scaled)” option opens a dashboard without vertical nor horizontal guides that scales the content of the dashboard to the window size in which you are viewing it. This option will have the prevent collision toggle off and the scale toggle on, which will scale the content and optimize the available space while making the content remain in the same relative position to the other content elements.
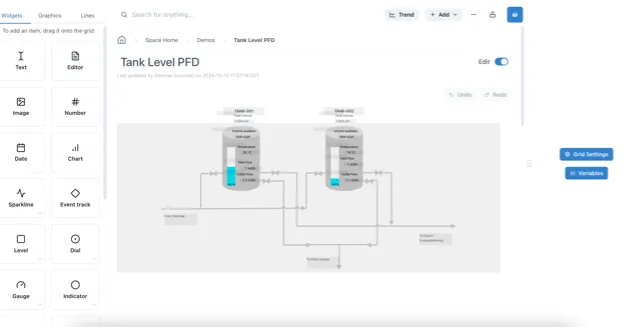
This is highly recommended when you build content that will be accessed through different-sized devices or when you want to create content with visual equipment representation and elements such as indicators, text, numbers, etc. on top of the image. Next, you can see an example of a scaled dashboard in its main view and edit mode. When you open this dashboard in a smaller window size, the text, numbers, indicators and levels will remain in the same position to the tanks in the image.
The content created with this option will also be available under the “Dashboards” option on the left side menu.
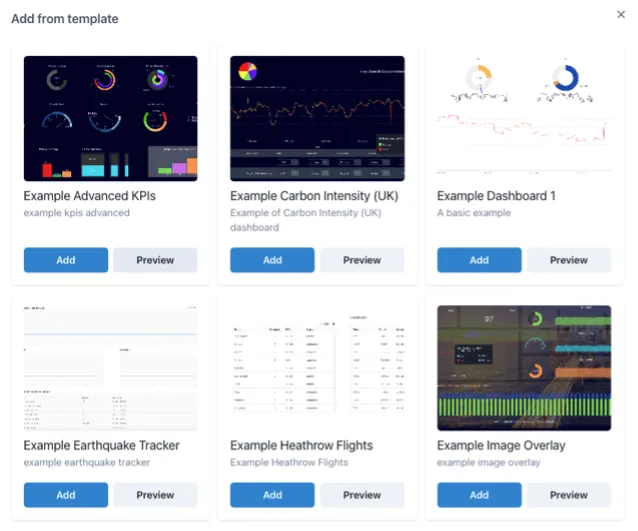
2.1.5 Add from template
Section titled “2.1.5 Add from template”If you don’t want to start your content from scratch, you can add a page from the template options and edit them. These templates vary but will contain highly used widgets such as charts, numbers, dials, levels among others. You can preview the different options before deciding which template to use.
2.1.6 Add Legacy chart
Section titled “2.1.6 Add Legacy chart”This option allows you to create a page with a Legacy chart, replicating the exact configuration and layout from the previous version. It’s ideal if you want to maintain the same chart appearance and setup as in Ingenuity 6.
2.1.7 Add Legacy dashboard
Section titled “2.1.7 Add Legacy dashboard”Adding a Legacy dashboard creates a page with an EPM macro editor, enabling you to create tables and content just as you would in Ingenuity 6. The editor’s configuration will mirror that of the previous version of Ingenuity.
![]()